India’s Education System: 10 Key Statistics & Data

India runs one of the largest school systems in the world, nearly 14.67 lakh schools and close to 25 crore students. But scale alone doesn’t tell you whether the Indian education system is actually working. To understand that, you have to look at the trends underneath the headline figures: how enrollment is shifting between government and private schools, whether children are actually learning to read, how infrastructure has changed over time, and where the gaps still sit.
This piece pulls together ten India education statistics from UDISE+, the Ministry of Education’s national school database, and ASER, Pratham’s annual household learning survey, tracked over multiple years wherever the UDISE+ data allows, so the numbers show direction, not just a single snapshot. Together, they’re some of the clearest education statistics in India available on where the system stands today, and where it’s headed next.
Number of Schools in India
India’s school count has stayed remarkably stable over the last four years, dipping only slightly from 14.89 lakh in 2022-23 to 14.67 lakh in 2025-26, even as enrolment patterns have shifted underneath it. What’s stayed constant is the sheer geographic spread: India’s school network covers rural blocks and urban wards alike, which is precisely why quality varies so sharply from one pin code to the next, even in a single city like Bangalore. A parent comparing two schools ten kilometres apart in the same city is often, in effect, comparing two entirely different education systems, one shaped by decades of infrastructure investment, the other still catching up, and this is the layer no single headline number can capture.
Number of Students in India
Total enrolment has been essentially flat for three years, holding around 24.7 to 24.8 crore students, per the UDISE+ 2025-26 Booklet, with a small dip in the most recent cycle. This national plateau sits on top of real state-level variation, some states are gaining students, others are losing them, a pattern the UDISE+ report’s state-wise tables break down in detail, a shift also connected to the government-to-private movement covered in more detail below.
UDISE+ Data: Number of Teachers in India
Unlike enrollment, the teaching workforce has grown consistently, crossing 1 crore for the first time in 2024-25, an 8.3% rise since 2022-23.
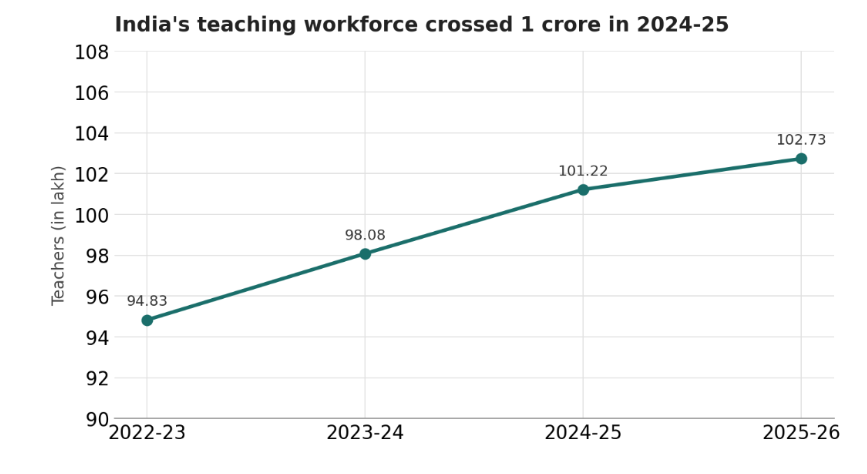
(Source: UDISE+ 2025-26. Figures represent the respective reporting periods and are not live data. Historical figures are included where available to show trends over time. )
Aggregate growth hides a distribution problem, though. Nationally, single-teacher schools dropped to around 1,00,843, roughly 3% lower than the previous year, and zero-enrolment schools fell nearly 29% to 5,663, per the UDISE+ 2025-26 Booklet, both moving in the right direction, but both pointing to the same underlying issue. A school can technically exist, technically be staffed, and still be functionally unable to deliver a real classroom experience if one teacher is handling every grade and every subject at once. India isn’t short of teachers anymore. It’s still learning how to place them where they’re needed.
Indian Education System: Pupil-Teacher Ratio
India’s national Pupil-Teacher Ratio now beats the NEP 2020 target of 30:1 at every stage of schooling, a trend the UDISE+ Booklet’s Table 6 confirms has held for two straight years.
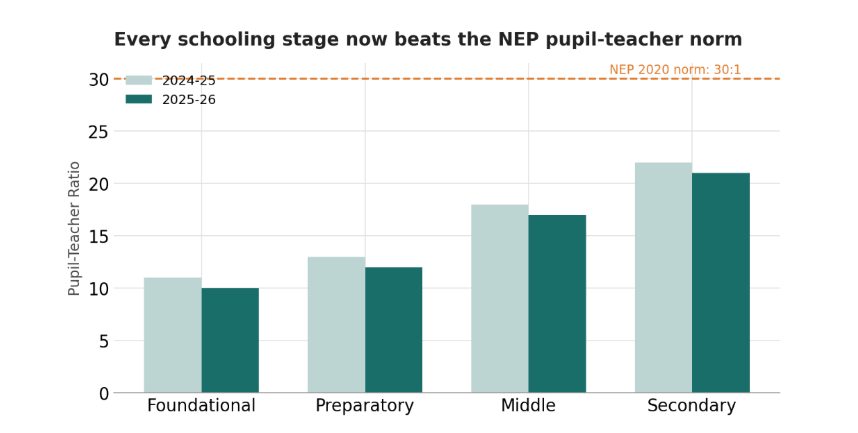
(Source: UDISE+ 2025-26. Figures represent the respective reporting periods and are not live data. Historical figures are included where available to show trends over time.)
On paper, Indian classrooms look under-crowded by policy standards. But a national average blends a well-staffed urban private school with an understaffed rural government one into the same number. PTR is one of the most misleading “good news” statistics in Indian education precisely because it hides exactly the kind of variation that matters most to an individual parent choosing an individual school.
Education System in India: Government vs. Private Schools
The shift in enrolment raises a bigger question: does attending a private school actually lead to better outcomes than attending a government school? We examine the latest data on fees, infrastructure, teachers and learning outcomes in our government school vs private school comparison in India.
This is the trend line worth watching most closely if you’re trying to understand where Indian parents are actually sending their children. Government and aided schools accounted for 65% of enrolment in 2022-23; by 2025-26, that had slipped to 58%, while private schools climbed from 33% to 40% over the same period.
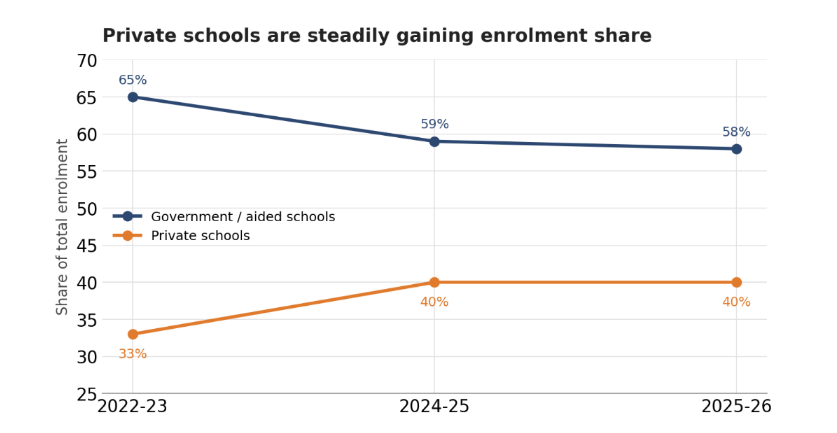
(Source: UDISE+ 2025-26. Figures represent the respective reporting periods and are not live data. Historical figures are included where available to show trends over time.)
It’s not that government schools are collapsing, in absolute numbers they still educate the majority of India’s children, it’s that private schools are absorbing a growing share of new enrolment. What the national data can’t tell us is why: whether this shift reflects genuinely better learning outcomes in private schools, or a stronger perception of quality, brand, and English-medium instruction driving the decision, independent of what the classroom actually delivers. That’s a question that needs school-level or state-level data to answer, not national aggregates, and it’s exactly the kind of question a platform built around individual school data, rather than national averages, is positioned to help answer.
India Education Statistics: Learning Outcomes
This is the number that should matter most to any parent, and it tells a story that enrolment data alone completely misses. The ASER 2024 findings show how many children are actually reading at grade level. For a deeper look at India’s reading outcomes, see our analysis of reading comprehension in India based on ASER 2024.
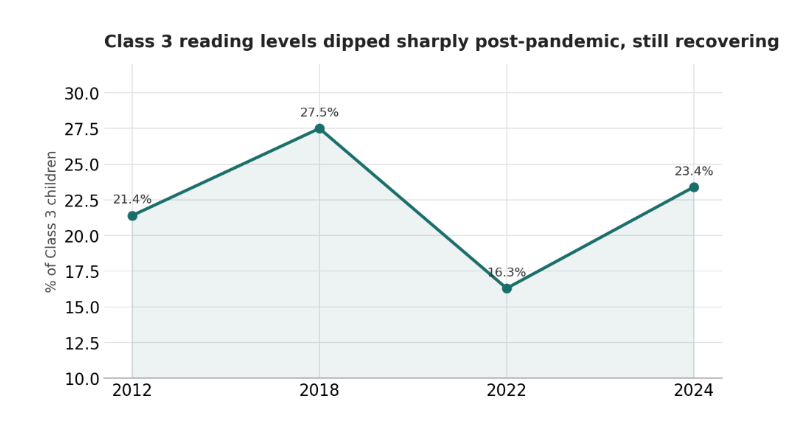
(Source: ASER 2024. Figures represent the respective reporting periods and are not live data. Historical figures are included where available to show trends over time.)
This is the gap between schooling and learning: a child can be enrolled, attending regularly, and still not read at grade level. It’s why foundational literacy sits at the centre of NEP 2020’s early priorities, and it’s a number worth asking about directly when evaluating any school, regardless of fees or brand. Arithmetic shows the same recovery pattern: the ASER 2024 full report found the share of Class 3 children who could solve a basic subtraction problem rose to 33.7% in 2024, up from 25.9% in 2022, but still below the 28.2% recorded in 2018, with government schools driving most of this gain.
Pre-Primary Education in India
Early childhood enrolment has been rising steadily according to both the ASER 2024 full report and the UDISE+ 2025-26 Booklet, part of a broader national push under NEP 2020’s foundational stage framework, which for the first time formally brings ages 3 to 8 under one connected structure. Karnataka, and Bangalore specifically, has seen this play out visibly, with preschool and pre-primary options expanding fast over the last decade. One caveat worth flagging: UDISE+ enrolment figures exclude Anganwadi centres and many private kindergartens, so the real number of children in some form of early education is very likely higher than official school-system figures capture. This is a case where the data hasn’t fully caught up with what’s happening on the ground.
Education Statistics in India: Gender Participation
On enrolment, India’s gender gap in school education has effectively closed, and in several states, reversed in girls’ favour. The UDISE+ 2025-26 Booklet puts girls’ share of total enrolment at 48.4%, up marginally from 48.3% the year before, with the Gender Parity Index now above 1 at every stage of school education, meaning girls’ Gross Enrolment Ratio proportionally exceeds boys’. Women also make up 54.9% of the teaching workforce, up from 54.3%. This is genuinely one of the strongest results in the dataset, a reversal of a gap that dominated Indian education policy conversations for decades. The caveat: this data covers enrolment only, it doesn’t tell us whether that parity holds through subject choices or progression into higher education, which would need a separate dataset like AISHE to confirm.
UDISE+ Data: Digital Infrastructure in Indian Schools
Basic school infrastructure has improved sharply over the past two years, though access and use remain two different things. The UDISE+ 2025-26 Booklet reports that 69.9% of schools now have computer access, up from 64.7% the year before, alongside 95% electrification and 98.5% of schools with functional girls’ toilets.
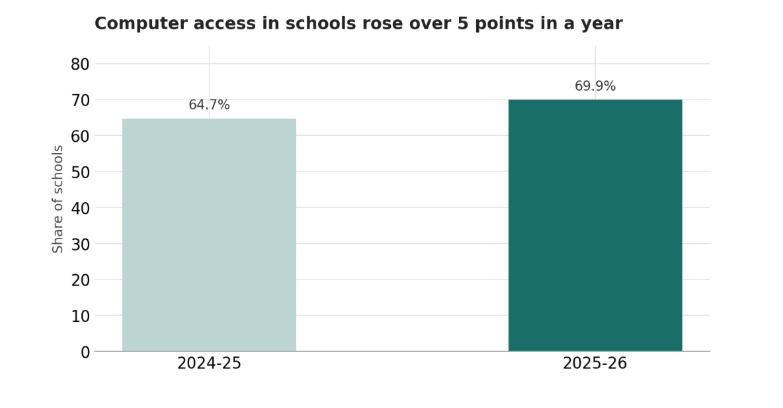
(Source: UDISE+ 2025-26. Figures represent the respective reporting periods and are not live data. Historical figures are included where available to show trends over time.)
A computer lab existing and a computer lab being used for regular instruction are two different facts, and UDISE+ tracks the former, not the latter. This is a number that measures the floor, not the ceiling, of India’s digital learning story.
Dropout and Transition Rates
This is where the system loses the most students, and the number that most complicates the “steady progress” narrative. The UDISE+ 2025-26 Booklet shows the secondary-level dropout rate falling from 8.2% to 7.0% year on year, while secondary GER rose from 68.5% to 71.7%.
(Source: UDISE+ 2025-26. Figures represent the respective reporting periods and are not live data. Historical figures are included where available to show trends over time.)
Transition rates tell the same story from a different angle: the UDISE+ 2025-26 Booklet shows 99.2% of children move from the foundational to preparatory stage, but that falls to 93.8% moving into middle school, and 88.3% moving into secondary. Each stage loses a few more children, and by the time you reach the top of the school system, the cumulative gap is significant, this is where India’s education story shifts from an access problem to a retention problem.
Indian Education System: What the Data Tells Us
Put together, these ten numbers describe the education system in India in transition on almost every axis at once. Access has genuinely, measurably improved: more schools, more teachers, better gender parity, and stronger basic infrastructure than a decade ago. Those gains are real and shouldn’t be understated.
But the deeper layers are more complicated. Enrolment is shifting from government to private schools faster than at any point in recent UDISE+ history, without clear evidence yet on whether that shift is driven by better outcomes or better perception. Reading levels have recovered from a pandemic low but haven’t returned to pre-2020 levels, per ASER. And the system’s biggest structural weakness isn’t getting children into school anymore, it’s keeping them enrolled and learning through to the end of secondary school.
For a parent evaluating any single school, the practical implication is this: none of these national numbers are a substitute for the actual data on an individual school, its retention rate, its learning outcomes, its teacher continuity. But they set the baseline you should be comparing that school against, and they explain why national conversations about “school quality” in India are rarely as simple as government versus private, or fee versus outcome.
Fourteen lakh schools, twenty-five crore students, and over a crore teachers make India’s school system one of the largest human enterprises anywhere in the world. The last decade of data from UDISE+ and ASER shows a system that has solved access mostly, and is now grappling, unevenly, with quality, retention, and the widening choice between government and private schooling.
Both datasets update every year, and we’ll be tracking these numbers as they shift, building future pieces in this series around the trends that these ten numbers only begin to surface: government versus private outcomes, the rural-urban learning gap, and the transition into higher education. For now, the honest summary is this: India has built the access. What it’s still building is the learning that access was always supposed to deliver.
Find the Right School for Your Child
Find the Right School for Your Child
Explore CBSE, ICSE & IB schools in Bangalore. Check real-time ratings, dynamic GPS coordinates, and complete fee charts instantly.